BIOMEDANA TWIN / LINE PERFORMANCE & CAPACITY
Locate the constraint behind fill-finish and packaging capacity
Editorial date
Frame the evidence and simulation needed to compare throughput losses, changeovers, buffers and product mix across a sterile line.
Engagement basis: Scoped line-modeling engagement and source-system integration
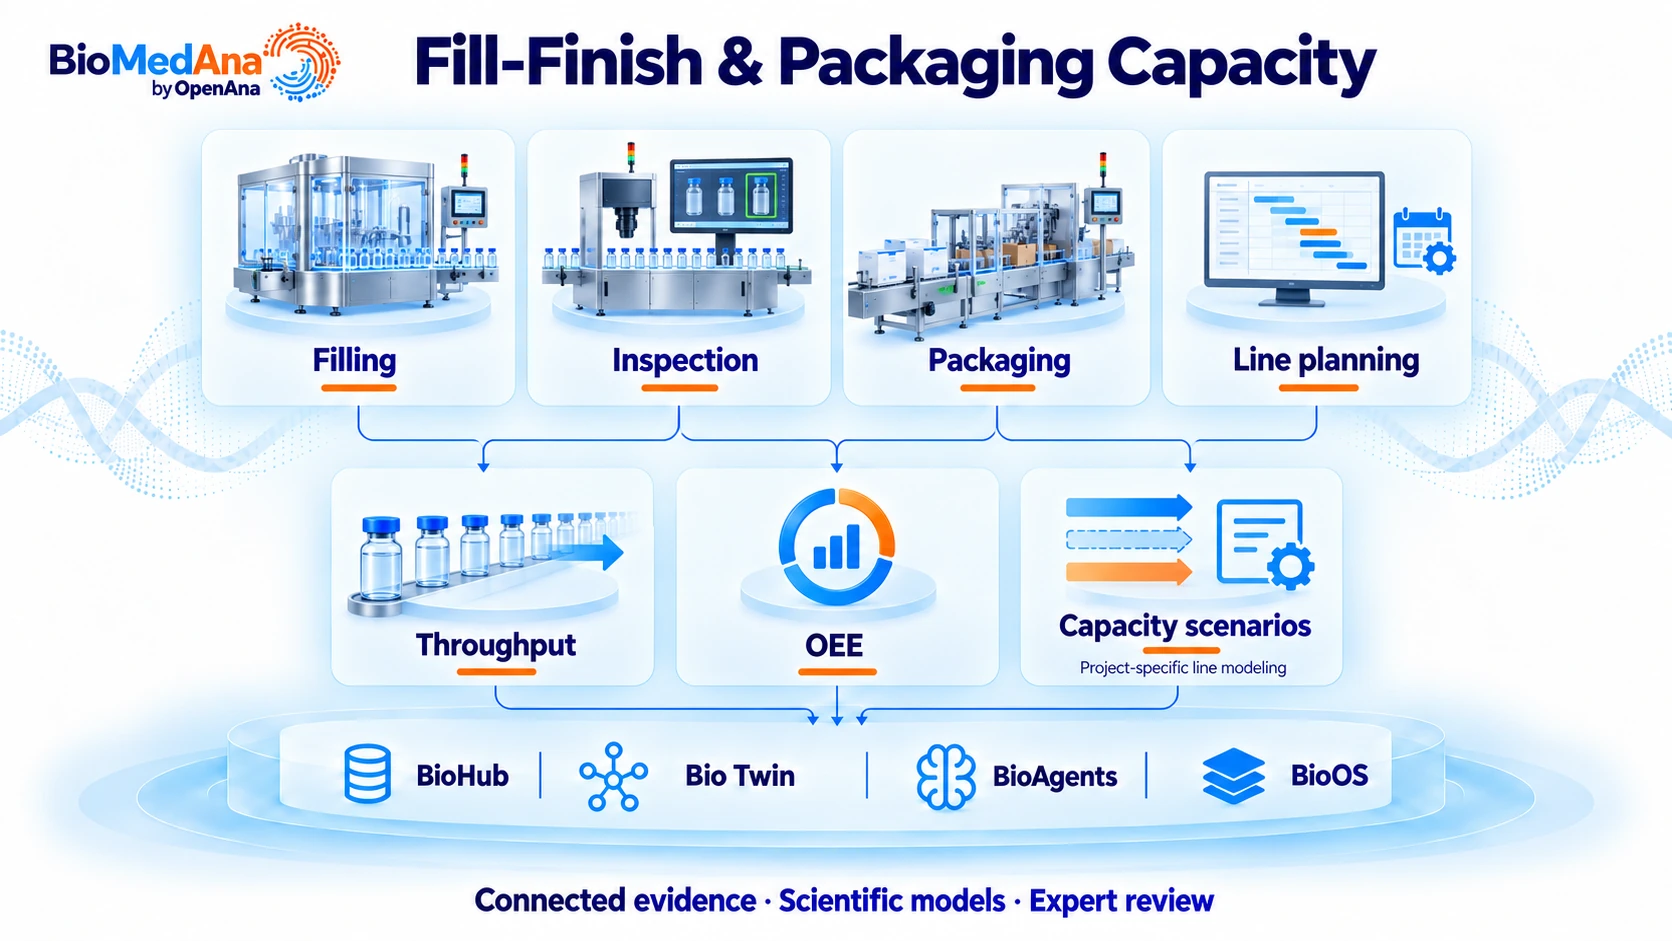
The filler meets its nominal speed. The site still misses the output plan.
A sterile fill-finish operation is asked to increase delivered output across a changing product and format mix. The filling asset is highly visible, so the first proposal is often to increase its nominal rate or add equipment. Yet the production plan also depends on inspection, packaging, changeovers, resource availability and the pattern of interruptions across the line.
Different functions can describe the same problem differently. Operations sees stops, maintenance sees repeat events, planning sees missed campaign windows and Finance sees a capacity investment request. OEE reports may not settle the argument if planned time, good counts or stop classifications differ between systems or product groups.
The scenario opens before an intervention is chosen. The sponsor needs to know whether the next unit of capacity is more likely to come from reducing a recurring loss, changing a campaign plan, addressing a downstream dependency or investing in a physical asset. The answer requires a line model and an agreed event basis, not a reactor-process simulation.
Would the next unit of capacity come from fewer losses, a different campaign plan or a changed asset constraint?
Identify which operational or capital alternative deserves the next controlled trial or investment study. Require a reconciled event basis and a suitable line model before treating a local speed or OEE change as a system-level capacity gain.
Who owns the decision
Site operations, industrial engineering, planning, maintenance and Quality
Reconstruct the line’s time and material story before simulating an intervention.
The team starts with the production boundary and reporting definitions. Good units, rejected units, planned production time, ideal cycle time and stop reasons must mean the same thing across the comparison. Overlapping events, clock mismatches or unclassified time can create an attractive loss chart without explaining delivered output.
Campaign context is added next. Product format, batch sequence, cleaning/changeover activities, working calendars, planned maintenance and applicable hold constraints affect the available operating window. A period with an easier product mix cannot serve as evidence that the underlying system constraint has improved.
A separately scoped line-simulation model then represents the relevant resource interactions: buffers, queues, blocking, starvation and shared dependencies. The baseline is challenged against actual production windows before alternative interventions are ranked. BioMedAna supplies an evidence and workflow foundation; the line model and source integrations are explicit engineering deliverables.
Start with a baseline your team can challenge.
| Evidence | What the team brings | How it informs the decision |
|---|---|---|
| Event and production records | MES/PLC exports, good and rejected counts, stops and reason codes, with synchronized timestamps. | Agree the event semantics and the production boundary. |
| Campaign and product mix | Format, batch sequence, changeovers, working calendars and planned maintenance. | Separate product-mix effects from persistent performance losses. |
| Line constraints | Asset rates, buffers, inspection and packaging dependencies, staffing and applicable hold limits. | Represent blocking, starvation and shared resources in a project-specific model. |
WHAT BIOMEDANA DOES / WHAT YOUR TEAM DECIDES
Connect the evidence.
Compare the scenarios.
- 01
Agree the performance definitions
Define planned production time, ideal cycle time, good count and the scope of availability, performance and quality. Resolve overlapping stop reasons and excluded time before comparing OEE.
- 02
Connect operational context
Scope approved MES, historian or event-data exports through the Hub evidence workflow. Asset-event mapping and the line’s data contracts are project-specific integration work.
- 03
Commission a line model
A suitable discrete-event or equivalent resource model is needed for buffers, queues, changeovers and dependencies. Calibrate it against actual production windows; the process-train duration tool is not a substitute.
- 04
Compare interventions on delivered output
Evaluate loss reduction, campaign sequencing, buffer or asset changes on the same horizon and product mix. Review uncertainty, execution feasibility and quality constraints before prioritizing an intervention.
Compare the alternatives on the same basis.
| Alternative | What is compared | What would change the answer |
|---|---|---|
| Reduce a recurring loss | Evaluate a specified stop or changeover improvement on a reconciled event basis. | Check whether the recovered time produces more good output or simply moves waiting to another asset. |
| Change the campaign or resource plan | Compare an agreed sequencing, buffer or availability alternative under the same product mix and horizon. | Retain staffing, hold, cleaning and quality constraints; a shorter local activity may not improve system throughput. |
| Change the asset constraint | Evaluate a physical capacity alternative using the scoped line model. | Determine whether the bottleneck shifts and whether the intervention remains favorable under realistic downtime and resource assumptions. |
A decision pack with an owned next step.
A line-capacity decision pack: agreed loss taxonomy and OEE denominator, source-event reconciliation, validated baseline-model results, intervention scenarios and a capacity-investment rationale.
| Review finding | Evidence interpretation | Next action |
|---|---|---|
| Baseline credible | Counts, time definitions and modeled baseline agree within site-set tolerances. | Proceed to intervention comparisons. |
| Constraint shifts | A faster asset increases blocking or moves the bottleneck downstream. | Evaluate the system-level change rather than its isolated speed. |
| Ranking uncertain | Product mix, downtime or resource assumptions change the preferred intervention. | Gather the missing event evidence or test a bounded operational change. |
Explain the finding before choosing the action.
The review should be able to explain why an intervention changes delivered output. If a faster filler only increases downstream blocking in the modeled baseline, the team has not established a system-level benefit. If reducing a recurring interruption creates usable production time under the agreed constraints, that becomes a candidate for a bounded operational trial.
OEE and capacity are reviewed together without treating them as interchangeable outcomes. A change can improve an OEE component while leaving the planning-horizon good count constrained elsewhere. Conversely, an apparent capacity improvement may reflect a different product mix or reporting denominator. The retained event and scenario basis makes those explanations challengeable.
The final pack links the loss taxonomy, baseline model, intervention scenarios, uncertainty and investment rationale. Operations and industrial engineering own the proposed action; maintenance and planning review feasibility; Quality determines the applicable controlled route. The subsequent trial or operating evidence establishes whether the forecast benefit was realized.
Show what changed, who owns it and how it is measured.
Record the baseline before introducing the workflow. Compare the complete effort and the quality of the resulting decision, including review, reconciliation and follow-up work. The measures below define an evaluation plan; they are not claimed customer results.
| Value question | Baseline to record | Evidence of progress | Owner |
|---|---|---|---|
| Production evidence | Reconciled counts, event timing, product mix and time definitions. | Completeness and agreement of the baseline used for comparison. | Operations/data owner |
| Model performance | Locked production windows and site-set acceptance tolerances. | Baseline and subsequent forecast error for good output and constraint behavior. | Industrial engineering/model owner |
| Intervention value | An explicit alternative, planning horizon and common resource basis. | Good output, loss burden and queue/hold exposure under the same scope. | Operations/planning |
| Investment decision | Current loss-reduction options and asset alternatives. | Whether evidence supports an operational change, further study or capital proposal. | Site sponsor/Finance |
Start with one decision. Retain the evidence as the work expands.
A staged delivery and review path
- 01
Agree the line boundary and definitions
Select the assets, product families, planning horizon and receiving decision. Define OEE components and the comparison basis.
- 02
Reconcile events and production context
Map approved source exports, timestamps, counts and stop reasons. Identify missing evidence that could reverse an intervention ranking.
- 03
Validate the specialist line model
Test the baseline against actual operating windows before evaluating alternatives. Review model assumptions and unrepresented constraints.
- 04
Run a controlled intervention review
Select a bounded trial or investment study, retain its acceptance criteria and compare observed outcomes with the forecast through the site’s established process.
The first engagement has an explicit boundary and receiving owner. New campaigns, source layouts, equipment evidence or model versions return through the appropriate review before the prior analysis is reused. Any broader use needs its own evidence and authorization.
Define success before relying on the model.
Use consistent definitions for good units per planning horizon, OEE components, changeover burden, queue/hold exposure and forecast error. OEE improvement and increased sellable output are evaluated separately.
Implementation and scientific boundary
This engagement requires a separately scoped line-simulation model, OEE definitions and source-system integration. BioMedAna process-train duration calculations do not provide a line-capacity forecast. Planning outputs do not establish sterility assurance, validate aseptic processing or authorize a line-speed change.
This use case defines a proposed workflow, its evidence and its decision path. It does not report measured customer outcomes. Acceptance criteria, model suitability and operating authority are agreed for the intended deployment.
START WITH YOUR DECISION
Make the next study
specific to your process.
Bring the available evidence, the model question and the people who will act on the result.